Measuring public opinion in movements
- Why measure public opinion?
- Challenges of using public opinion polling in research
- Is polling relevant to every movement?
- Opportunities for better public opinion polling on movements
- Challenges of studying news & social media coverage
- Resources for studying public opinion
- Google resources
- Bonus discussion: The left, the right, and polling
Why measure public opinion?
In the Momentum organizing model, we say that a movement needs both“passive support” and “active support”to win. “Passive support” is essentially public opinion in support of a movement - meaning, people will respond favorably to poll questions about the movement (or the issues it brings up), news coverage will adopt the movement’s framing of an issue, social media activity around the issue will be high, and so on. In movements, public opinion tends to shift relative to increased movement activity. In other words, passive support increases when active support increases.
There are many cases in movement history where big, seismic shifts in society - legislated by politicians - only came after public opinion had already shifted to support the coming change (and the politicians no longer found it tenable to stick to their old positions).
To better understand how social change happens, it would be useful to have as many snapshots as possible of what the public thinks about important social issues over long periods of time.
Understanding the level of passive support for any given issue is also a useful tool for organizers, who can use that information to identify opportunities for recruiting people who are “passive supporters” and turning them into “active supporters” who participate in advancing the goals of the movement.
Challenges of using public opinion polling in research
Again, when we look for polling on an issue, we’re saying that we need to understand what the American public thinks and what the changes in public opinion are over time in order to fully understand how movements work.
Any academic or social scientist would tell you that polling has its own limitations to being a true reflection of “what the public thinks.” The limitations include the understanding that respondents are influenced by everything from the wording of the question to the race of the person asking it of them. Also, people may say one thing and do another – which is why measuring active support is equally as important as measuring passive support.
It is best to see polling as an important marker of public opinion – wherein different results can be compared to each other over time to see relative change.
The polling that exists is usually in one of the following categories:
Done by large, professional polling organizations such as Pew or Gallup, who release reports or posts highlighting some of their polling results but charge tens of thousands of dollars to access specific results
Commissioned by an organization or a candidate on a short-term basis to create a strategic plan around a particular goal, such as focus-group testing a message to be used in an election or assessing the popularity of a ballot proposition
Conducted by a news organization – sometimes that news group asks the same question over time, but often it asks questions in one-off instances in order to make or support a claim in an article
Is polling relevant to every movement?
When considering how to measure public opinion, polling can be a more or less relevant tool in the context of each specific movement.
For example, polling organizations have consistently asked broad, values-based questions about racism since the 1990s. Consistently, Pew and Gallup have asked respondents to assess ‘the state of race relations today’ and ‘whether we have made enough progress on racial equality.’ Reading trends in responses to those questions, we can easily compare the fluctuations to periods of anti-racist movement activity.
On the other hand, polling about undocumented immigrants tends to take the form of questions about specific policies. When respondents are asked about whether they would favor work visas in one year and whether they would favor deportation in another, it is difficult to get a clear sense of pro- or anti-immigration sentiment overall over time.
Additionally, with the way public polling is currently done, some movements may be too brief to be assessed by polling organizations that are slow to start polling on a new movement. For example, more poll questions exist about Black Lives Matter specifically than about Occupy Wall Street – the former has lasted longer and has had more cycles of escalation than the latter.
So, for some movements and existing polling, it may be more valuable to use other metrics of public opinion. For example, looking at the effects of Occupy Wall Street on changing the dominant frames of income inequality in the media is useful. And looking at actual voting patterns on immigration is useful because voting is not only an opinion but an action and can be considered as both passive and active support.
Opportunities for better public opinion polling on movements
We believe movement researchers would benefit from more:
Polling that asks the right questions – including questions about broader issues, discrete tactics being used by a movement, and values
Polling that asks the same questions consistently over time – including asking about the broader, most important social issues of our time whether or not levels of movement activity are high in that month or yearandcontinuing to ask questions about movements after movement activity is done (i.e., continuing to see what people think of Occupy Wall Street for 10+ years after the fact)
Polling that measures “intensity” of support, that could be translated into categorizing the public into a “spectrum of support”
Polling that is available to the public or to non-profit organizations for free or for an affordable price
See more ideas on polling to polarize a base, or how conservatives do polling differently, below at The left, the right, and polling.
Examples of polling “intensity” of support:
It would be great if polls approximated what we see as the spectrum of support, with responses of strongly support, somewhat support, neutral, somewhat oppose, strongly oppose (some questions are posed this way already, but not all!)
For example, some of the new polling on climate change from the Yale Center on Climate Change Communications is impressive and able to be well-fitted to the spectrum of support idea. Example, from the May-June 2017 report:
- Six in ten Americans (63%) say the issue of global warming is either “extremely” (10%), “very” (16%), or “somewhat” (38%) important to them personally. Four in ten (37%) say it is either “not too” (22%) or “not at all” (15%) important personally.
Another interesting example that YCCC does is ask how often people talk about climate change with friends and family – “often,” “occasionally,” “rarely,” or “never.” That could be interpreted as an interesting measure of passive and potentially active support.
- Only one in three Americans (33%) discuss global warming with family and friends “often” or “occasionally,” while most say they “rarely” or “never” discuss it (67%). Additionally, fewer than half of Americans (43%) hear about global warming in the media at least once a month, and only one in five (19%) hear people they know talk about global warming at least once a month.
Challenges of studying news & social media coverage
Aside from looking at public opinion polls for this research, our team looked for data about how much news coverage movements were getting in traditional and social sources.
The limitations of studying media coverage and social media coverage include access to data and ability to code the data – how to get a huge database of articles on your topics and also developing a system to sort through massive databases of articles and track articles that are specifically related to the query.
It is possible to access sources that track print media, such as LexisNexis Academic Universe, through institutional subscriptions. However, tracking social data (for example, reading tweets with a certain hashtag) can be extremely expensive because the data must be purchased from the social media platforms themselves. A social media analysis provider told us that, even without their services on top, acquiring data from Twitter for the past 5 years of tweets would cost over $15,000.
The resource and time intensity of data tracking is noted here because most movement organizations are not well resourced.
One media-assessment tool we used was GDELT’s Television Explorer, which tracks mentions of topics on request across major television networks. It is somewhat limited by the fact that most outlets were only tracked since 2009, with some added since 2013. Similarly, MIT Media Cloud’s tool to track online news seems like a promising future source of data but is still in development and presents some challenges in terms of tagging outlets as digital only versus print. It looks like new open-source media tracking resources will be more and more promising as time goes on.
This is why, whenever possible, we relied on reports commissioned by institutions or peer-reviewed academic research to give us conclusions about media and social media. For example, we relied on the amazing report called Beyond the Hashtags by folks from the Center for Media & Social Impact for all analysis of Twitter data during the Black Lives Matter movement.
Resources for studying public opinion
Here are some examples of some common sources for polling, news media, and social media. We did not use every single one in our research but hope they may be helpful to others. Also, see this link for further resources on tracking polling with a state or regional specialization, compiled by the Cornell Institute for Social and Economic Research.
Polling database resources
Roper Center Public Opinion Archives
Specializes in public opinion surveys & has local, state, national and international pools
Data on American politics includes coverage relating to presidential approval, U.S. elections (including exit polls), and congress.
The U.S. General Social Survey which is conducted by NORC, is distributed by Roper.
Examples--search for ‘Black Lives Matter’ came up with 2 poll results:
- CNN/Kaiser Family Foundation Poll: August 2015, Survey of Americans on Race - asks about equality, economics, policing, and more -- includes a few questions on Black Lives Matter like this one:
- CNN/Kaiser Family Foundation Poll: August 2015, Survey of Americans on Race - asks about equality, economics, policing, and more -- includes a few questions on Black Lives Matter like this one:
CNN/ORC Poll: 2016 Presidential Election/ Barack Obama Presidency/ Combat Operations Against ISIS/ 10-Year Review of Hurricane Katrina - includes Black Lives Matter question:
There are more polls about specific events, peaceful vs. violent protests in Ferguson, protests in Baltimore, etc.
They have some video webinar/support webinars about how to download their datasets or analyze them through their tool, RoperExplorer, where it makes you easy tables comparing different questions and variables on demand -- seeexample
They have some information on ‘race relations’ as topic at a glance
How to cite data from the Roper center for your publication


“This statistics tool compares citizens' responses – region by region, nation by nation – to questions of vital importance to the world today, on topics such as economic conditions, government and business, healthcare and well-being, infrastructure and education.”
Very limited questions/topics -- good for seeing change in political affiliation over time, though; they present information on a topic in tables over time rather than in individual datasets e.g.:

Gallup Brain - only accessible through subscription databases
“The Gallup Brain is a searchable, living record of more than 70 years of public opinion research. Coverage is 1930 forward.” It is unclear how to access the Gallup Brain site without an institutional subscription, but the Gallup News site seems to have plenty of articles with data and insights gleaned from the Gallup Brain system.
Has topic overview of data on race relations – good data on peoples’ perceptions of race relations broken down by race, over many years - for example:
Most useful for summary articles they produce on their data, such as Six in 10 Americans Say Racism Against Blacks is Widespread (August 2016).
The Gallup Poll Social Series uses the same questions in the same month of the year every year - this dataset could be helpful if it asks questions relevant to the topic you are studying. Accessed through Gallup Analytics.

General Social Survey and GSS Data Explorer
“The GSS contains a standard 'core' of demographic, behavioral, and attitudinal questions, plus topics of special interest. Many of the core questions have remained unchanged since 1972 to facilitate time-trend studies as well as replication of earlier findings. Registration required.”
A quick look at race-related variables/questions in the GSS Data Explorer makes it seem like a lot of those questions were only asked in 1 year (as opposed to several years over time, to be able to compare), although there are some time-trend data available for approval of protest activity.
Pew Research Center for People and the Press
“The Center is an independent opinion research group that studies politics, public policy issues, and attitudes toward the press. It is best known for regular national surveys that measure public attentiveness to major news stories, and for polling that charts trends in values and fundamental political and social attitudes.”
See reports on race & ethnicitytopic category - last one out in 2015; many over specific events such as Baltimore protests or Zimmerman verdict; looks like policing was a topic they started focusing on more specifically since 2012.
Example: The Racial Confidence Gap in Police Performance(September 2016)
Example article: How Americans View the Black Lives Matter movement(July 8, 2016).
Can search for polling questions (& results) by keyword - such as keyword search‘Black Lives Matter’.
Doesn’t seem super easy to find results to exact same questions asked over time.
American National Election Studies (ANES)
“The American National Election Studies (ANES) produces high quality data on voting, public opinion, and political participation to serve the research needs of social scientists, teachers, students, policy makers and journalists who want to better understand the theoretical and empirical foundations of national election outcomes.”
They have Time Series studies that have been conducted since 1948.
- “Topics cover voting behavior and the elections, together with questions on public opinion and attitudes of the electorate. In all Time Series studies, an interview is completed just after the election (the Post-election or "Post" interview); during years of Presidential elections an interview is also completed just before the election (the Pre-election or "Pre" interview).”
On the more difficult side to decode the data on the master time series study and understand whether the right questions for us are in there. “Resources” page is broken on the website.
News search resources
- Search newspaper content by keyword from 1972 - present.
ProQuest National Newspapers Premier
Can do keyword search on anything within time periods up to the modern day -- looks like for some reason data is only available from 1980 onwards; at least, when searching “Mass incarceration” or “Black lives matter” as keywords.
Covers 53 newspapers -- can access list of newspaper titles & first/last dates.
- Search newspaper content by keyword; this is a database frequently cited in social scientists’ formal research as the source for news coverage.
PEJ News Coverage Index (through Pew Research Center)
The PEJ News Coverage Index analyzes a wide swath of American news media to identify what is being covered and not covered-the media’s broad news agenda.
Each week, the Index issues a report on the top stories across the mainstream news media, as well as a breakdown of how the news agenda that week differed among the media sectors–network TV, for instance, vs. cable or newspapers.
The Index focuses on a primary variable-the topic of the story-and measures what percentage of the newshole analyzed is about that topic.
- An open-source tool for studying media ecosystems; interesting tool but differentiation between print and online news is still under development by the researchers.
- “In collaboration with the Internet Archive's Television News Archive, GDELT's Television Explorer allows you to keyword search the closed captioning streams of the Archive's 6 years of American television news and explore macro-level trends in how America's television news is shaping the conversation around key societal issues. Unlike the Archive's primary Television News interface, which returns results at the level of an hour or half-hour "show," the interface here reaches inside of those six years of programming and breaks the more than one million shows into individual sentences and counts how many of those sentences contain your keyword of interest.”
Social media tracking resources
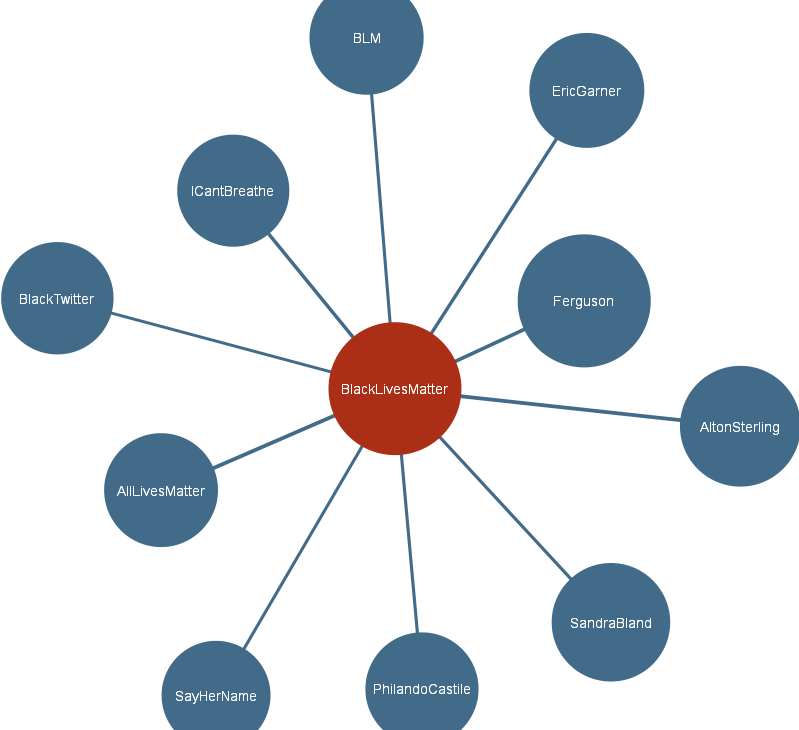
Can visualize top hashtags associated with a certain hashtag by Twitter users, like #BlackLivesMatter below (shows correlation numbers when you mouse over)
Could be useful to understand what trigger events people most associate with a movement
If you sign up for free you can see charts of popularity of hashtag usage over time
Realtime local Twitter trends, anywhere in the world. Depends on data of variable reliability from users self-disclosed location in the world.
Have to sign up for a 1 week free trial (or subscription) to access all features.

- Can be used to make maps of events around a certain issue with some basic data -- likethis mapsomeone made of Facebook events/groups related to #OWS around the country. Could probably be done cheaply/quickly with a bit of tech help. Maybe there are more ‘hacks’ to run with it, such as maps of events over time.

Google resources
See article on pitfalls of using Google Books Ngram Viewer to study language usage
Someone suggested possibly searching by topic - such as if you search “prisoner” and “victim,” you see the salience/mentions of “prisoner” go down just as mass incarceration is booming, while salience of “victim” goes up. More to be explored.
Visualizes global search interest.
Quick search on Black Lives Matter-- search volume seems lower than we would have expected, and come up with spikes later than we would have expected. Need to learn how to use the tool more/read about how it works and what its pitfalls are.
Google Politics & Elections Blog:What search trends tell us about Occupy Wall Street and the Tea Party(October 27, 2011)
- Find searches that correlate with real-world data (such as...which search terms go up in popularity when the weather gets colder, etc.)
The left, the right, and polling
Background
During our work studying what is known about the metrics of public opinion on social movements, it was impossible not to come across comparisons between “the left” and “the right” on how they have built or lost power over the past few decades.
Since the ‘90s, led by Clinton and Blue Dog Democrats, the Democratic party has been engaging in the strategy of triangulation which is about adopting parts of the opponent’s ideology or framing one’s goals in their terms. In basic terms, Democrats have aimed to win or keep power by being seen as a blend of both ideologies and by actively trying to win over their opponents from the other side.
On the other hand, Republicans have been ignoring the left, instead focusing on energizing their own base - especially into consistent local and state action. The Tea Party’s emergence in 2009 became the expression of this strategy, on steroids. That has attracted members of the middle to their side.
Since so much electoral work is about inspiring people to action (or at least voting) through messages, the below sections describe some important ideas about how language appeals to voters’ values and how polling can be used to better identify the language that will appeal to our own base. This is an art which conservatives are much more advanced in than liberals.
Messaging through values
George Lakoff is a professor at UC Berkeley and pioneer of cognitive linguistics, understanding political worldviews, and framing messages. He is the author of Metaphors We Live By (1980), Moral Politics (1996), and Don’t Think of An Elephant! (2004).
The main thesis of Lakoff’s work is that conservatives and progressives have worldviews based on different sets of values, that are deeply ingrained into our neural networks. There are people who have a dominant conservative worldview, people who have a dominant liberal worldview, and biconceptuals - people who use both lenses in different parts of their lives.
Lakoff argues that repeatedly hearing messages “framed” in a way that evokes a liberal or conservative worldview (on the radio, by politicians, in our classrooms, etc.) strengthens the hold of that neural pattern and worldview on our brains.
As the New York Times describes, “The most compelling part of Lakoff’s hypothesis is the notion that in order to reach voters, all the individual issues of a political debate must be tied together by some larger frame that feels familiar to us. Lakoff suggests that voters respond to grand metaphors...as opposed to specific arguments, and that specific arguments only work if they reinforce some grander metaphor.”
Essentially, when liberals try to win over conservatives by messaging our goals in their language and their frames, we do more harm than good because we are reinforcing the conservative value system in the brains of our conservative and biconceptual audience members - and not connecting with the liberals whose support we hope to keep.
That is thanks to another critical part of his argument - that our brains are not made to accept facts that do not fit the frames we hold. Lakoff “says cognitive science has proved that all of us are programmed to respond to the frames that have been embedded deep in our unconscious minds, and if the facts don’t fit the frame, our brains simply reject them...the frames in our brains can be ‘activated’ by the right combination of words and imagery, and only then, once the brain has been unlocked, can we process the facts being thrown at us.”
He argues that liberal politicians need to be able to “frame” their messages in a way that will activate liberal value systems rather than conservative value systems, energizing their liberal base and bringing biconceptuals to our side rather than reinforcing their conservative values.
And they need to repeat those same messages over and over and over.
Quick example: Lakoff brings up that the phrase “tax relief” was pushed out by the Bush administration from 2001. Those words “frame” taxes as a burden from which to be relieved - a conclusion rooted in the conservative value system. Yet, he says that Democrats continued to use the words “tax relief” in subsequent years, reinforcing the validity of that worldview. He asks, how might a liberal reframe taxes as an investment into our society? Or as a patriotic duty, the dues we are obligated to pay as members of this huge ‘country club?’ How do we communicate that private wealth is built upon public goods funded by taxes, such as roads, the Internet, and more? That is just one great example from Don’t Think of an Elephant.
Polling strategies
Polling is relevant to thinking about the strategies of the “left” versus the “right” when we consider that polling, focus groups, and similar forms of testing the reactions of the American audience are often used to develop candidates’ messages.
Political strategist Ryan Clayton, in a conversation with Paul Engler, described the differing approaches of Democrat and Republican pollsters when developing messages:
Defining who counts as a supporter, and using polarization to win
Clayton said that Democrats will poll-test a message and appreciate getting a certain level of support from the entire population - and will congratulate themselves for ‘even’ getting the support of some Republicans. On the other hand, some Republican-employed pollsters will remove Democratic respondents from their final polling numbers and see how much support their message got among Republicans and the middle (unaffiliated or undecided voters) - in other words, they seek a polarizing message.
Clayton argues overall for the benefits of polarization: that a good message creates a positive pull towards your side and creates negative repulsion from the other side, so that people in the middle see the other side as villains and come to you. That is a different approach than reaching out to the middle by trying to portray yourself as being the perfect blend of both sides.
As a consequence, Clayton said, “If you’re catering to Republicans in your messaging and counting them as equivalent to Democrats, the problem is your strategy and tactics are divorced. Because Republicans are never going to vote for a Democratic candidate, no matter what they say, even if they agree with you in polling. Whereas Democrats may not come out and vote if you sound like a Republican.”
Intense reactions → transmission of a message
Clayton also mentioned that Republicans value theintensityof the support for a message from members of their own base, because they understand that having a certain group of supporters feel extremely strongly about a message will inspire them to become analogous to “peer-to-peer marketers.” The most active supporters will spread the fervor of the message that activated them to the rest of the base and to members of the undecided middle.
One positive example on the Democratic side that Clayton points to is Bernie Sanders: because he did not commission poll-testing or watch existing polling to dictate his messages. Clayton and others have argued that Sanders believed the Achilles heel of the left was ignoring the “real issues” that people cared about (see: issues that energize the base, such as inequality) and that it was his opening to connect with a left base used to being sold-out for “the middle.”
Ideas for next steps
Clayton suggested that it would be possible to:
Reexamine past polling conducted for Democrats. Go back to Democratic pollsters, look at previous polling that they have done to test messages, and reexamine the relative success of different messages when Republican support for a message is taken out of the equation. In other words, we could look at what messages were most likely to be well-supported by the base and we could see for ourselves whether that candidate or our party has been using that message or a message with more appeal to “the middle.” Of course, Clayton would also suggest adopting this kind of analysis from the start, going forward.
Ask pollsters to prioritize measuring and reporting on intensity of support over breadth of total support. Clayton mentioned meeting a pollster in DC who measured both % of total support and intensity of support, and that he would prioritize the latter. For example, if a message was getting the support of 60% of the population but at a 70% intensity level, he would prefer that message over one with support of 70% of the population but at a 60% intensity level. An example would be:
- “If you knew that Bob cheated on his wife, would you be more or less likely to vote for Bob?” “I’d be less likely to vote for Bob.”“Ok, how much less likely would you be to vote for Bob, on a scale from 1-5? 1 being I will never vote for him, 5 being kind of less likely?” That scale would gauge the intensity of the response. Clayton said that many pollsters have picked up this kind of data but do not prioritize it in their reporting.
Commission messages crafted from a foundation of base support. Clayton explained that he worked on crafting messages for immigration rights campaigns in the style of Frank Luntz (a right-wing pollster and advocate of energizing the base). His colleagues did over 100 deep-dive interviews with people on the left, including immigrants, managers of immigrants, organizational executive directors, and more - and they drafted messages about immigration from those interviews, which they workshopped in focus groups with people from “the middle.” They refined the messages based on feedback from the middle, then dial-tested those messages on a cross-section of the general population. They registered high positive feelings from advocates and the base, positive feelings from people in the middle, and low or no positive feelings from members of the opposition -- which is exactly the desired result. Note: dial-testing is a survey technique in which people give real-time feedback about how hearing a particular message makes them feel.