Active & passive support for the 2006 megamarches
Read more about what active & passive support means, and read more about active & passive support for DREAM activists.
About the 2006 megamarches
In 2005, Representative F. James Sensenbrenner (R-Wisconsin) introduced HR 4437 in the House. HR 4437 was a draconian anti-immigrant bill that would make being in the U.S. without authorization (undocumented) a criminal infraction, rather than a civil infraction.
Among other provisions, the bill would also make providing services (such as school, church, etc.) to undocumented immigrants a crime; would require companies to use E-Verify to make sure their employees were documented; and called for new border fencing.
It passed the House on December 16, 2005 by a vote of 239 to 182 (92% of Republicans supporting and 82% of Democrats opposing). HR 4437 was the first piece of legislation passed by a House of Congress in the context of the “illegal immigration” debate – and it became known as the “Sensenbrenner bill” and catalyzed widespread outrage and protest.
In the spring of 2006, an estimated 3.5 to 5.1 million people participated in marches in over 140 cities and 39 states. For example, there were estimated to be hundreds of thousands in Chicago and over 1 million in Los Angeles – two of the first cities to march.
Read on for the story of the passive & active support behind this movement moment.
Active support
Growth of protest events
How do we tell whether this outpouring of activity is unusual for the immigrant civil rights field? Law professor and immigrant rights scholar Sylvia R. Lazos recounts how the 2006 megamarches compare to an important action in 2003:
“The 2003 Immigrant Workers Freedom Rides to Washington, D.C., marked the only prior successful immigrant civil rights protest [to 2006]. In September and October 2003, grassroots migrant organizations in collaboration with worker organizations “came out from the shadows” to fight back against 9/11 harsh measures against immigrants. Then, an estimated nine hundred persons boarded eighteen buses traveling from ten cities and descended on the US capitol. The final stop in Queens, New York, sparked a demonstration of tens of thousands. [And over 100,000 in DC.] By comparison, the Spring 2006 pro-immigrant marches involved an estimated five million marchers, protests were staged throughout the United States in hundreds of small and large cities, and marchers represented a wide cross section of American society.”

Here’s a map of the 2003 freedom rides:
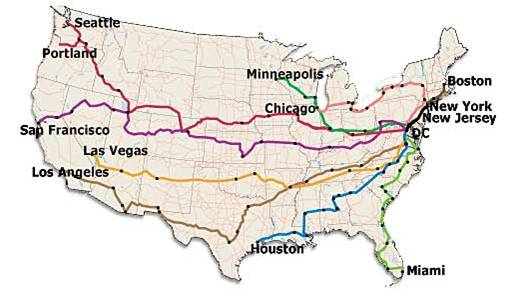
The 2003 freedom rides were indeed special because actors from the “structure” model (labor unions) mobilized people to join from outside the structure model: “Over 100,000 people greeted the Immigrant Workers Freedom Ride (IWFR) here Oct. 4, celebrating the birth of a new movement with its sights set on making the 2004 elections a battle for immigrant rights. The dynamic, coordinated effort of unions, immigrant and civil liberties groups, clergy, and elected officials was initiated by HERE, the hotel and restaurant employees union, and sponsored by the AFL-CIO” (source).
Yet, the 2006 marches in response to the trigger event that was the passage of the Sensenbrenner bill were exponentially larger.
Initially, the very first march was organized by grassroots groups in Chicago and then replicated around the country by local organizers. The Los Angeles march was the largest and became a trigger event on its own, inspiring others to host their own marches a few weeks later.
As mentioned earlier, the megamarches in response to the proposed Sensenbrenner bill numbered 100,000 in Chicago and > 500,000 in Los Angeles, with participation in 140 cities and 39 states (source).
Full estimates per city can be found in a dataset compiled by Xóchitl Bada, Jonathan Fox, Elvia Zazueta, and Ingrid García for the Wilson Center – they estimated the total participation in Spring 2006 to be from ~ 3.5 million to 5.1 million at marches over the course of Spring 2006.
For example, the Bada et al. database catalogued 9 separate events in Los Angeles (through news coverage) in the spring of 2006 with participation rates:
| Los Angeles | 3/24/2006 | 2,700 | La Opinión Digital |
|---|---|---|---|
| Los Angeles | 3/25/2006 | 200,000-500,000 | Los Angeles Times, La Opiníon |
| Los Angeles | 3/26/2006 | 3,500 | La Opinión Digital |
| Los Angeles | 3/27/2006 | 8,500-36,500 | News Journal Delaware Online, AP, Dallas Morning News, NYT, Walla Walla Union |
| Los Angeles | 3/28/2006 | 6,000 | El Barlovento |
| Los Angeles | 3/31/2006 | 100 | La Jornada |
| Los Angeles | 4/6/2006 | 100-900 | La Opinión Digital |
| Los Angeles | 4/10/2006 | 10,000 | San Francisco Chronicle |
| Los Angeles | 5/1/2006 | 650,000-700,000 | LA Times, La Opinión, Fox News, La Jornada |
A different study with lower participation estimates created a map of protests in terms of size and location from Feb 14th 2006 - May 1 2006:

The same study also mapped # of protests and protest size in waves over time:

Annotations by our team:

Growth of electoral engagement
One form of active support is whether people are voting more in line with the movement.
One of the slogans of the 2006 megamarches was “Hoy marchamos, mañana votamos” (today we march, tomorrow we vote). Did Latino voters vote more often in the aftermath of the marches? There seems to be little evidence for increased number of voters, but there is evidence to suggest more Latino voters started to vote with the Democratic party.
Read the following sources for more detailed information:
2006 midterm elections suggest Hispanic voters were energized by marches (LA Times_, _by Paul and Mark Engler):
Conservative Miami Herald columnist Andres Oppenheimer wrote: ‘Hispanics said 'adiós' to President Bush's Republican Party… voting in much greater numbers than expected for Democratic candidates in an apparent rejection of the ruling party's efforts to blame much of the nation's problems on undocumented migrants.’
Contrary to experts' predictions that Hispanics would not turn out massively on Tuesday, exit polls show that Hispanics accounted for 8 percent of the total vote. That is about equal to the Hispanic vote's record turnout in the 2004 presidential election, and much more than its turnout in previous mid-term elections.
What's more, 73 percent of Hispanics voted for the Democratic Party on Tuesday, while only 26 percent voted for Republican candidates, CNN exit poll shows. In the 2004 presidential elections, 55 percent of Hispanics voted Democrat and about 42 percent voted Republican.
Of 15 races where immigration was the center of the debate, tracked by immigration2006.org, 12 were won by immigration moderates and only two by hard-line anti-immigration activists.
Academic study of 2006 midterm turnout suggests Hispanic voters did not vote in higher #s but were more likely to vote Democrat:
“Lazos Vargas (2006, p. 840)reports that “independent exit polls of Latina/os voters for the 2006 elections show that Latina/o voter turnout in November 2006 (58.9%) was only slightly higher than it was in the last midterm elections of 2002 (57.9%).” The slight differences do not indicate increased Latino voter turnout. However, Latinos were much more likely to vote Democrat, turning away from the party of the Republican Representative Sensenbrenner. She concludes: “The promise—or threat—of ‘hoy marchamos, mañana votamos’ may take several election cycles to show tangible numerical results” (Lazos Vargas, 2006, p. 840).”
More details from Lazos Vargas herself -- “The data shows that Latina/os did not turn out at significantly higher rates in 2006. Independent exit polls of Latina/os voters for the 2006 elections show that Latina/o voter turnout in November 2006 (58.9%) was only slightly higher than it was in the last midterm elections of 2002 (57.9%). By comparison, turnout statistics of the entire electorate edged up very slightly by 0.7%, from 39.7% in 2002 to 40.4% in 2006. These small differences do not necessarily show that Latina/os were more motivated to vote in this election cycle. Voter turnout in the US is low and has been steadily falling. Some political scientists believe that this is due to elections becoming less interesting to the voter. Strategies that protect incumbents (which include drawing favorable districts and huge advantages in raising campaign funds) have made most races non-competitive. Under this view, voters go to the polls when they think that their votes matter.Accordingly, focusing on Latina/o vote turnout may not be a good measure of whether the immigration marches influenced the Latina/o electorate.Latina/o voters act like all other voters, they turn out when candidates are competitive and issues are interesting."
“Exit polls show that in the 2006 elections Latina/os were more likely to vote for the Democratic congressional candidate. According to exit polls, two-thirds voted for the Democratic Congressional candidate.”
LA Times article corroborating that stable Latinx turnout in CA was due to lack of interesting issues:
- President of Southwest Voter Registration Education Project (Antonio Gonzalez) said 1.2M CA Latinos voted, 100k higher than 2002 election. But short of 1.5M his group hoped for. Problems: group only managed to raise $250k out of $1M it wanted for voter registration; few candidates or ballot measures that generated the excitement or controversy needed to drive higher turnouts.
One argument in a NYT op-ed that long-engagement is not increasing:
“Between 2000 and 2012 the number of Hispanics eligible to vote grew by almost 10 million, but the number of actual voters increased by half as much. Even with immigration reform on the line, fewer than half of eligible Latino voters cast ballots in the two Obama elections, compared with around two-thirds of whites and blacks. This lackadaisical approach to civic engagement extends even to the population most affected by federal immigration policies. Eligible immigrants from Mexico adopt United States citizenship at about half the rate that newcomers from all other countries do.”
Pro-Democratic leanings look like they continued from 2006-2012 at least (Pew):
“According to national exit polls conducted after the 2012 election, Obama garnered 71% of the Hispanic vote (27% voted for Romney). Obama’s national vote share among Latinos was the highest for a Democratic candidate since 1996, according to an analysis of the exit polls by Pew Research Center.”
Potentially, measuring Latinx polarization towards Democrats (as long as Dems are seen as the ‘pro-pathway-to-citizenship’ side) may be more relevant than measuring actual #s of voters (Pew):
“In the past, Latinos have been consistently underrepresented in the electorate, compared with their share of eligible voters or the overall population. In the current survey, only about half of all Latinos (49%) say they are “absolutely certain” they are registered to vote. That compares with 69% of blacks and 80% of whites.
There are several reasons why the share of Latinos who are registered to vote is lower than it is among blacks or whites. Many Latino immigrants may be in the U.S. legally but have not yet obtained U.S. citizenship. Many others are in the country as undocumented immigrants. Both groups are not eligible to vote, yet they make up about 30% of all Latino adults.”